
Free guideVersion 1.0November 11, 2026
Volume Profile Day Trading
Volume profile trading reads where shares actually changed hands: price spends most of its time, and most of its volume, inside consolidations, and the thin gaps in the profile between them are areas price tends to cross quickly on its way to the next consolidation.
When you buy an option, the market maker who sold it usually hedges by buying the stock as price moves up (for a call) or selling it as price moves down (for a put). In a low-supply gap there are few sellers waiting, so that forced hedge buying can push price further in your direction. It is not a guarantee, but it can give you an edge because the option reprices quickly.
How to draw the four lines
- Chart setup. Open a 2-minute chart. Add TradingView’s built-in Visible Range Volume Profile and a 20-period SMA.
- Zoom. Scroll out to see the multi-day volume profile. Scroll in as the day goes on to focus on today.
- Blue lines. Draw a blue horizontal line at the top and at the bottom of the current consolidation.
- Yellow target lines. Draw a yellow line where the next consolidation starts above, and another where the next consolidation starts below. If none is in view, zoom out until you see one.
- Entries (mechanics, not advice). Call on a breakout above the top blue line. Put on a breakout below the bottom blue line.
- Position. Buy a 0DTE call or put, sized at 1–5% of your account.
- Exits. Sell at the yellow target, if price goes back into the consolidation, or if a new consolidation starts (often near an options strike price).
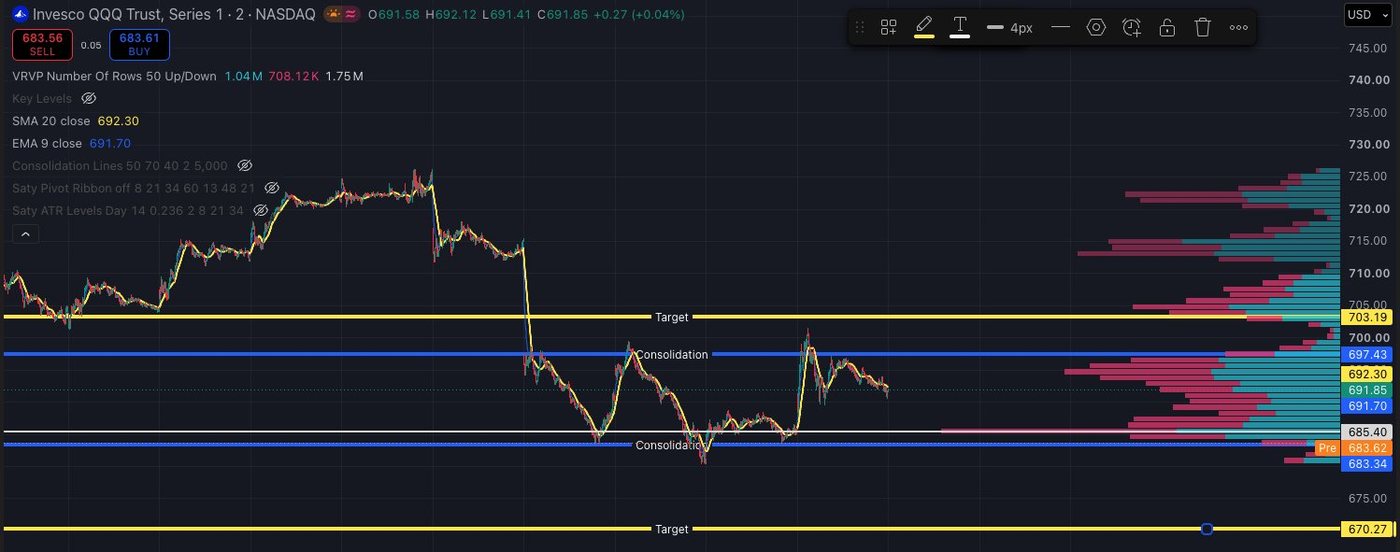
The only rule
Do not hold options while price is in consolidation. Sell at the yellow target, if price goes back into the blue box, or if a new consolidation starts forming.
Additional information below
Definitions
- Volume profile
- A histogram on the price axis showing how much volume traded at each price for the bars on screen. TradingView’s Visible Range Volume Profile rebuilds when you zoom or scroll.
- Consolidation
- A price zone where trading was heavy and price chopped sideways. On the profile it is a thick, stacked band of volume. The blue lines mark its top and bottom.
- Value area
- The band of prices that together hold most of the visible volume, often about 70%. The current consolidation is usually the value area of the bars on screen.
- Point of control (POC)
- The single price row with the most volume. It is the longest bar on the profile.
- High-volume node (HVN)
- A thick row or cluster of rows: prices the market has accepted, where price tends to slow down and spend time.
- Low-volume node (LVN) / volume gap
- A thin stretch of rows between consolidations: prices the market mostly skipped. There is little resting supply there, so price tends to move through quickly.
- Target line (yellow)
- A line at the starting edge of the next consolidation above or below, which is the near edge of the next heavy-volume area beyond a gap.
- Breakout
- Price leaving the current consolidation past a blue line and entering the gap. A call is the option that gains if price keeps rising; a put gains if price keeps falling.
- New consolidation
- Price stops traveling and starts stacking volume in a fresh band, often near an options strike price. It is an exit signal and the start of a new blue box.
- Time decay
- An option loses value as time passes when price goes nowhere. Inside a consolidation price is being absorbed, so decay works against the option and the directional edge is gone. That is why the only rule is not to hold options there.
- 20 SMA
- The average of the last 20 closing prices. On a 2-minute chart that is roughly the last 40 minutes.
One Strategy to Rule Them All
You don’t need to learn complex strategies and chart patterns like the ones below. The volume profile explains each of them: every one comes down to price breaking out of a consolidation at the edge the volume profile already shows (the blue line) and traveling through the thin gap to the next consolidation (the yellow line).
- Support and resistance. Support and resistance are the bottom and top edges of the consolidation on the volume profile, the blue lines. When price breaks through one of those levels, that is the break of consolidation, and it tends to run to the next consolidation at the yellow line.
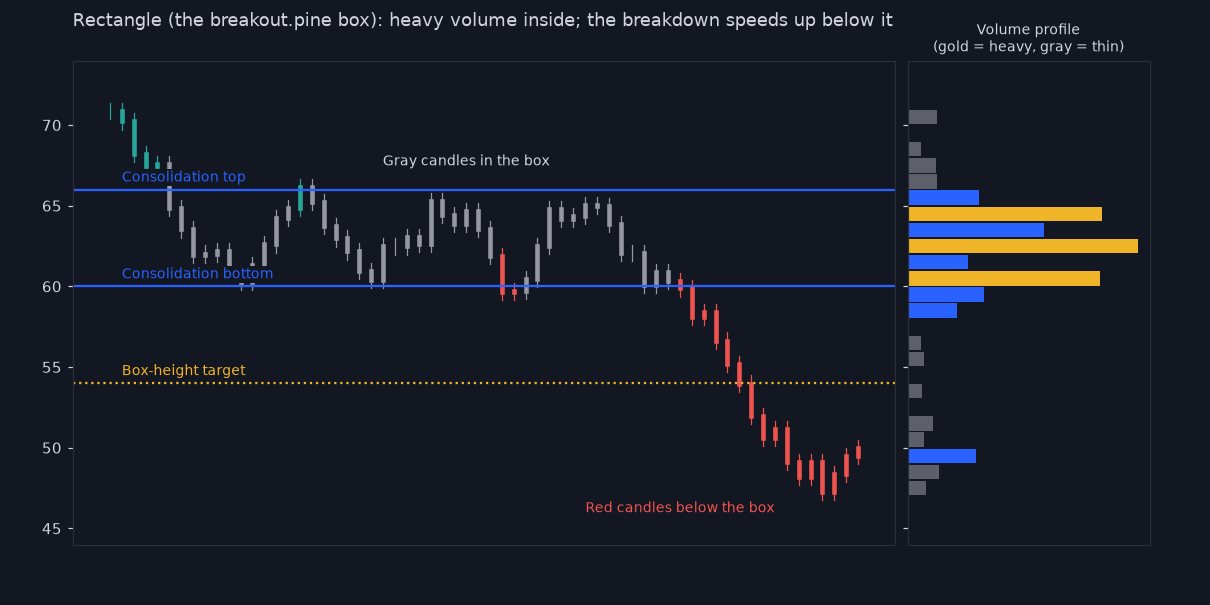
- Rectangles and trading ranges. A rectangle is the blue box itself. The breakout is the break of consolidation at the same level as the volume profile’s edge, and the move runs through the thin gap to the next consolidation.
- Wyckoff accumulation and distribution. The Wyckoff trading range is the consolidation on the profile. A spring (below) or upthrust (above) is a false break that comes back into the box. The sign of strength into markup, or sign of weakness into markdown, is the real break of consolidation at the volume-profile edge, and it runs to the next consolidation.
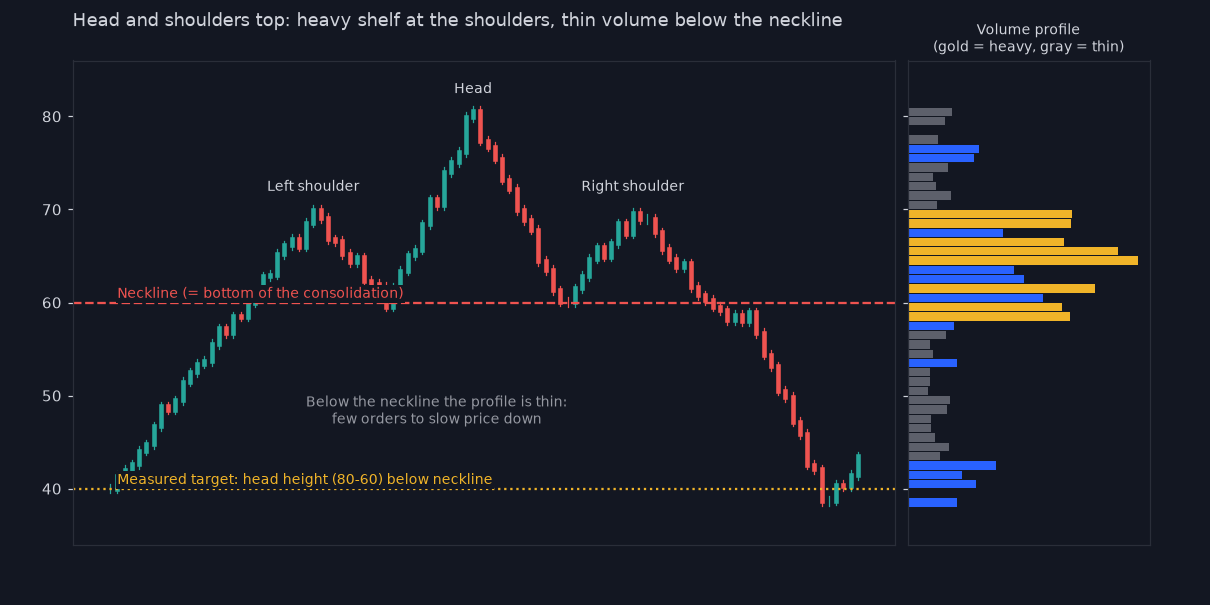
- Head and shoulders. The neckline sits at the edge of the consolidation on the volume profile, so the neckline break is the break of consolidation at the blue line. The move then runs through the gap toward the next consolidation.
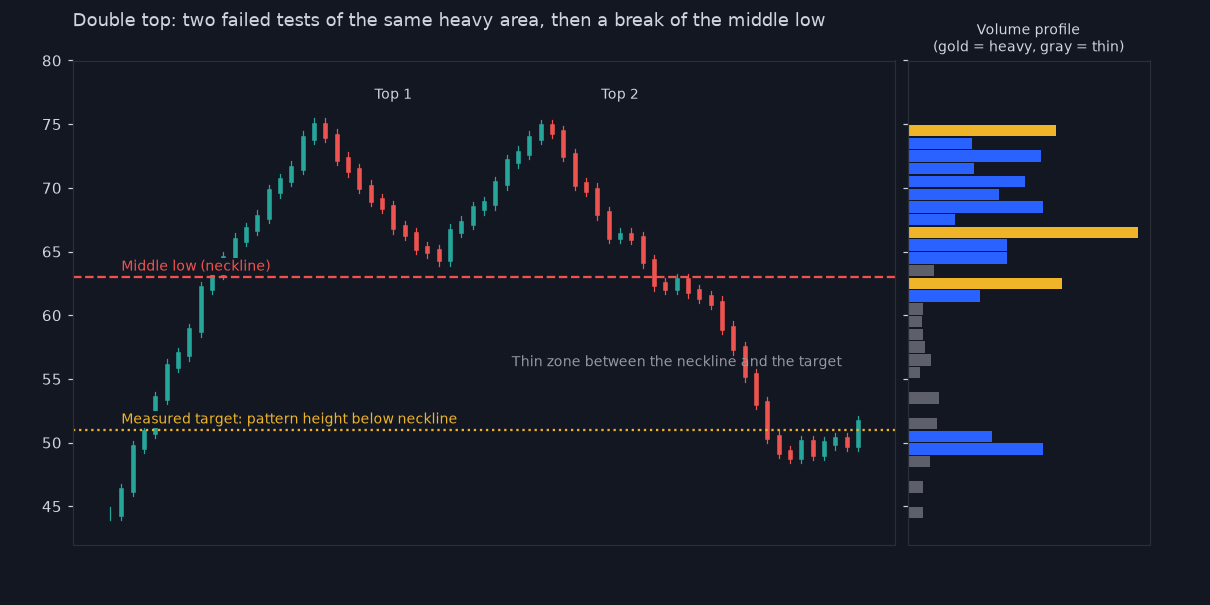
- Double tops and bottoms. The two tests happen inside the same consolidation, and the neckline between them is the consolidation edge on the profile. The neckline break is the break of consolidation at that level, and the target is where the next consolidation starts.
- Triangles, flags, and pennants. Each of these is a small consolidation. The breakout from the pattern is the break of consolidation at the same level as the volume-profile edge, and it usually goes toward the thinner side of the profile, on to the next consolidation.
- Measured moves. The measurement starts at the breakout point, which is the break of consolidation at the volume-profile edge. Instead of adding the box height, the yellow line shows where the next consolidation actually begins.
- Gap fills. A price gap leaves a thin, skipped zone on the profile. The fill starts when price breaks out of the consolidation at the profile’s edge on the gap side, and it runs quickly through the gap to the consolidation on the other side.
- Candle patterns. A strong full-body candle that closes outside the box is the break of consolidation at the volume-profile edge. Long wicks are failed breaks that close back inside the box, and dojis or inside bars are small consolidations.
- Option strike pinning. Heavy open interest at a strike can hold price there, so new consolidations often form near big strikes. The pin ends when price breaks out of that consolidation at the edge the profile shows.
- Dealer gamma hedging and gamma squeezes. A gamma squeeze starts with a break of consolidation at the volume-profile edge. When dealers are short gamma, their hedging adds fuel through the gap to the next consolidation; when they are long gamma, it pushes price back into the box.
- 70% value-area transitions (the “quantum” idea). The value area is the consolidation on the profile. Price jumps to the next value area only after it breaks out of the current one at the profile’s edge, crossing the thin gap instead of drifting.
- VIX expected move. VIX divided by 16 is a rough one-day move in percent. When that move reaches past the consolidation edge on the profile, a break of consolidation there and a trip to the next consolidation fit inside a normal day.
- Elliott Wave theory. Each impulse wave starts with a break of consolidation at the volume-profile edge and runs through the low-volume gap to the next consolidation. Corrective waves are price building that next consolidation before the next break.
The rest of this document explains why the same volume-profile picture sits underneath familiar chart patterns and other technical ideas.
What the profile is showing
A volume profile is a histogram on the price axis. Each horizontal row shows how much volume traded at that price over the bars currently visible on the chart. TradingView’s Visible Range Volume Profile rebuilds whenever you zoom or scroll, so the picture always matches what you can see.
The blue consolidation lines are the top and bottom of the current value-area shelf. The yellow targets sit at the near edge of the next thick shelf beyond each gap.
Why a breakout can speed up
A breakout from a shelf into a gap often moves faster than the chop inside the shelf. Several mechanics stack up; none of them guarantee follow-through.
- Orders pile up just outside the shelf. Stop-losses and breakout entries sit just beyond the blue edges. When price crosses, those orders become market orders at roughly the same time.
- Thin air / less inventory in the gap. Inside the shelf, many shares already changed hands, so buyers and sellers are waiting there. In the thin stretch above or below, fewer resting orders absorb the flow, so price has to travel farther to find the other side. That is the low-volume node on the profile.
- Volatility cycles. Quiet ranges are often followed by more active stretches. A tight shelf is compressed volatility; when it ends, the first leg is often larger than the moves inside the box.
- Trapped traders. Anyone who bet on the range holding, and is now wrong, has to exit. Their exits add to the move in the breakout direction.
- Dealer hedging (optional, short). When traders buy a lot of short-dated calls (or puts), market makers who sold those options hedge by buying (or shorting) the underlying. As price keeps moving, that hedge has to be adjusted — dealers who are short gamma buy into rallies and sell into drops, which can add fuel. The opposite (dealers long gamma) can pin price near large option strikes. For one person in a liquid name like SPY or QQQ, a handful of contracts rarely moves the market; these effects matter when the market as a whole is crowded in the same strikes.
The same mechanics also explain failed breakouts: if the stop and breakout orders get filled and no new participation arrives, price falls back into the shelf.
How common patterns look on a profile
Most chart patterns are pictures of the same volume-profile idea: a heavy shelf, a thin gap, and a leave of that shelf.
- Rectangle. Flat top and bottom with heavy volume inside. That is the blue box itself.
- Head and shoulders (or double top / bottom). Repeated tests of the same high-volume area that fail. The neckline is the edge of that shelf. Breaking the neckline is the same event as leaving the consolidation: stops fire, price enters the thin zone, and trapped traders exit.
- Triangles and flags. A narrowing or short pause after a sharp move. The break still goes into whichever side of the profile is thinner.
- Measured-move targets. Adding the box height to the breakout edge is a rough guess at how far price travels. The yellow line answers the same question more directly: it marks where the next pile of volume begins.
The diagrams below are simplified teaching drawings (not live market data). Gold rows are heavy volume, blue are medium, gray are thin.
Why new consolidations often form near option strike prices
Large open interest at a strike attracts hedging flow. When dealers are long gamma around that strike, their hedging tends to sell rallies and buy dips, which can keep price pinned nearby. When the pinning ends, or when a break finally leaves that shelf, a new thick volume band often starts building at the next crowded strike. That is why a yellow target is not only an exit level — it is also a place where a new blue box may form. If price fails to hold there and the next gap opens below (or above), the method simply redraws: the failed shelf becomes the old consolidation, and the next heavy edge becomes the new yellow line.
Watchlist idea
The method needs liquid names with clear shelves and gaps. A practical daily filter:
| Filter | Starting point | Why |
|---|---|---|
| Market capitalization | Roughly $200B+ | Large, liquid names; tight spreads in stock and options |
| Relative volume | Elevated (for example > 1.5× normal) | Unusual participation today |
| Day’s percentage change | Large up or down | Something is actually moving |
| Profile gaps | Visible thin rows between shelves on today’s (or multi-day) visible-range profile | Room for a fast move once price leaves a shelf |
Also check option liquidity on the strikes you would actually use (tight bid-ask, meaningful open interest). Intraday profiles change through the day, so a gap at 10 a.m. can fill by noon. Mega-caps move less in percentage terms than small caps; a few percent in a trillion-dollar name is already a large session.
Worked examples from recent charts
These are screenshots from QQQ and SPY charts posted in early November 2026. Each one teaches a piece of the four-line method. Prices named below are what is visible on the chart, not forecasts.
Waiting inside the blue box (QQQ, Nov 6, 2026)
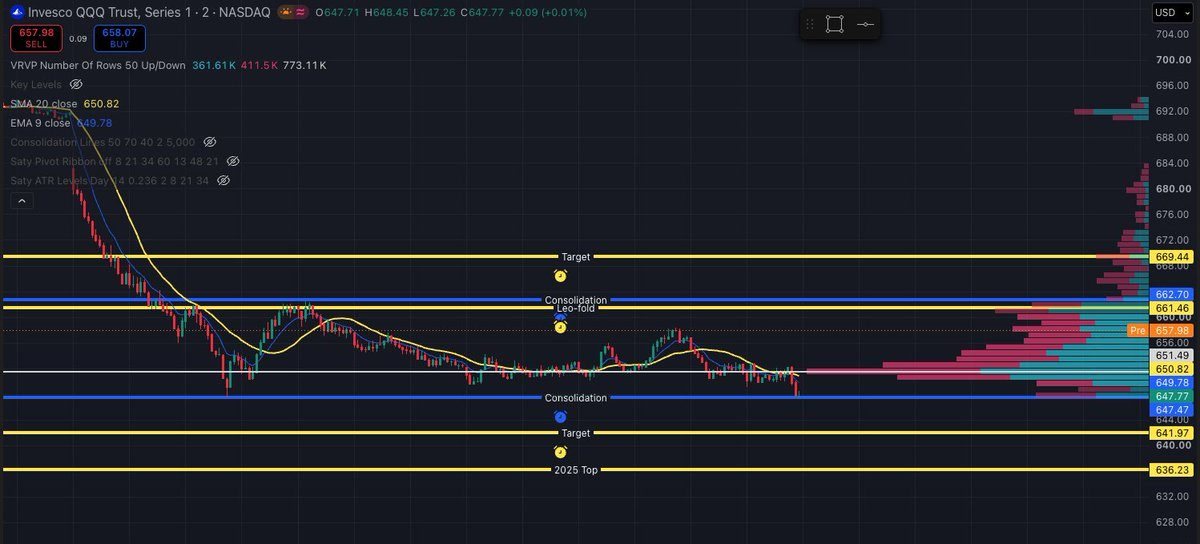
A cleaner shelf-and-gap structure (SPY, Nov 6, 2026)
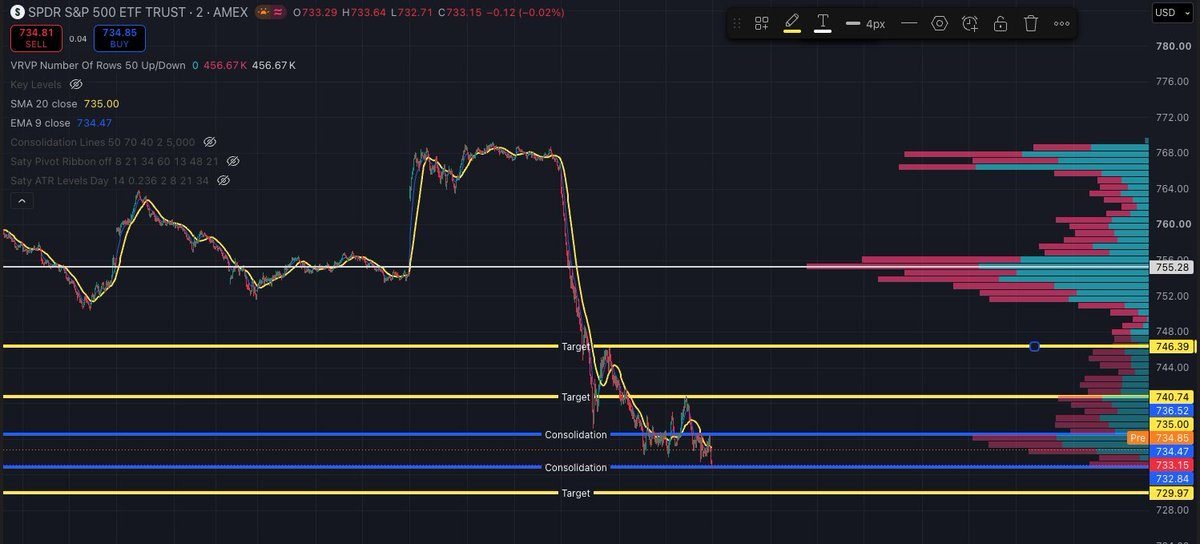
Sell when it hits the yellow target (QQQ, Nov 5, 2026)
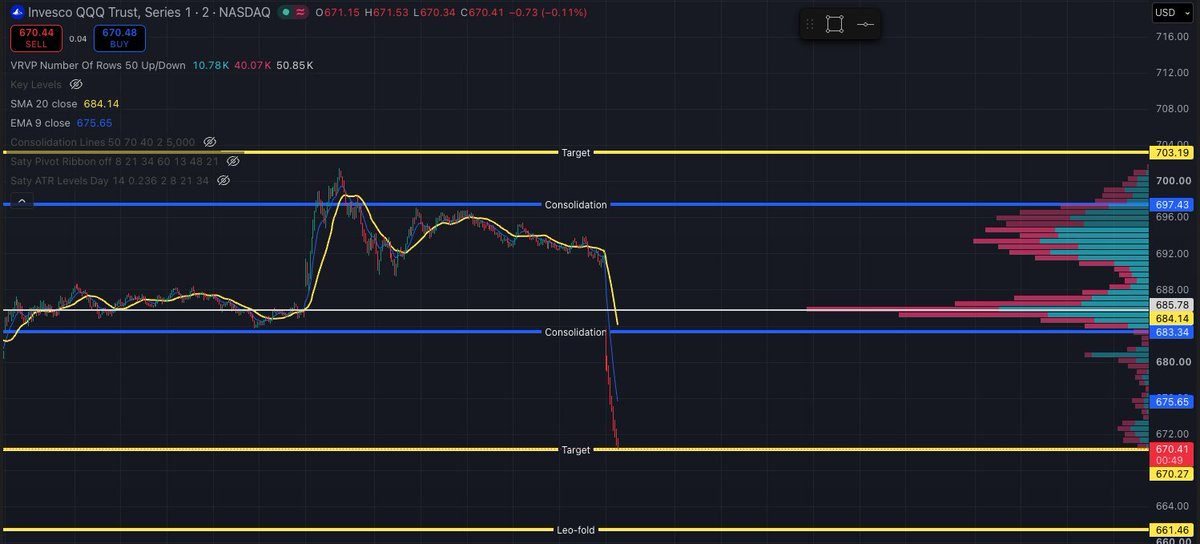
Target as a possible new consolidation — and what if it fails (QQQ, Nov 5, 2026)
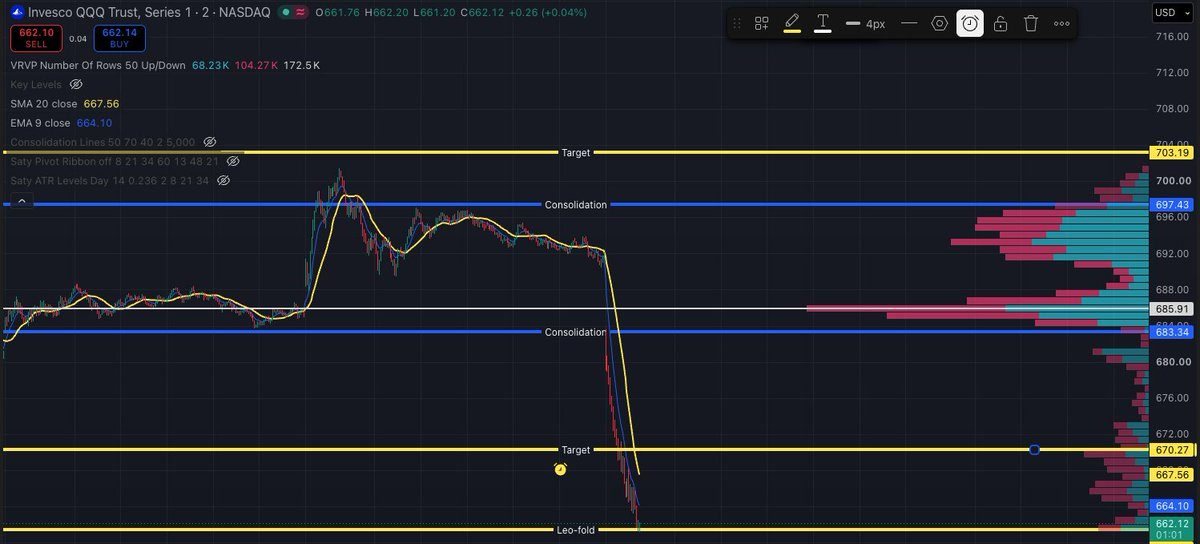
(The Nov 5 chart captioned “If $QQQ doesn’t catch a bid, there’s not much support below” uses the same blue/yellow framing as the page-1 teaching figure, so it is not repeated here.)
Recap
- Four lines. Two blue at the top and bottom of the current heavy-volume shelf. Two yellow at the starting edges of the next heavy shelves above and below.
- Two tools. TradingView Visible Range Volume Profile and a 20 SMA on a 2-minute chart. Zoom out for multi-day shelves; zoom in as the day develops.
- One rule. Do not hold options while price is inside consolidation. Sell at the yellow target, on a return into the blue box, or when a new shelf starts forming.
Version History
- 1.0 — Initial draft release, November 11, 2026.
- 2.0 — Free indicators with webhooks. Release date TBD.
- 3.0 — Automated trading and setup. Release date TBD.
Support my family
If this helped you land a big win, and to help keep it free unlike paid subscriptions and Discord groups, support me and my family here.